

All the Webinars below are now available for Free. Each Video includes Real-time computer screen views of NeuroGuide with audio so that viewers can share the instructor’s desktop on their own desktop. One can follow the instructor’s key strokes and analyses by opening exemplar EEG files inside of NeuroGuide.
Pause, stop and move forward and backward and replay sections at your leisure. Each Webinar includes analyses of real clinical cases as exemplars of EEG and linkages to functional localization in the brain. Local synchrony of neurons and short and long distant connectivity will be evaluated and where possible the patient’s symptoms and complaints will be linked to de-regulation in focal as well as diffuse or generalized brain dysfunctions.
The central theme of all the Webinars is hands on education of how NeuroGuide can be used as a collection of conventional EEG tools married to a collection of NeuroImaging tools where one can visually verify events in the EEG and attempt to link those events to the patient’s symptoms and complaints.
Recorded on November 20, 2013
Introduction to NeuroGuide: Basic File Import, Export, Artifacting, Reliability Tests, Re-Montaging and Creating New Montages
Recorded on December 4, 2013
After visual identification learn how to evaluate the 3-dimensional source of spike and waves, epileptiform events, bursts of EEG activity, etc.
Recorded on December 18, 2013
Learn about EEG Spectral Power, Simultaneous Conventional EEG & Normative database comparisons, Z Scores and Basic Clinic Report Writing.
Recorded on January 8, 2014
Learn about Low Resolution Electromagnetic Tomography (LORETA) for Current Source Localization and Brodmann Area Coherence and Phase.
Recorded on January 22, 2014
Learn How to Compare Pre vs Post Treatment Effects based on Changes in the Surface EEG as well as the 3-dimensional Sources of the EEG.
Recorded on February 12, 2014
Learn about Joint-Time-Frequency-Analyses (JTFA) Instantaneous Power, Amplitude Asymmetries, Coherence, Phase Differences (Raw and Z scores).
Recorded on February 26, 2014
Connectivity Suite – apply coherence, phase delay, cross-spectra, co-modulation, in-phase & out-of-phase analyses (Raw and Z scores).
Recorded on March 12, 2014
Learn about Phase Shift Duration and Phase Lock Duration
Recorded May 5, 2018
Learn about EEG Cross-Frequency Coupling. LORETA Cross-Frequency Coherence, Cross-Frequency Phase Reset, Cross-Frequency Phase-Amplitude Coupling and Dynamic Bi-Spectra.
Recorded on April 9, 2014
Learn how to create a symptom check list match and how to conduct 1-19 channel surface EEG Z score neurofeedback and automatic protocol generation. Learn about thresholds, protocols, linking symptoms to functional networks, rounds and progress charts.
Recorded on April 23, 2014
Learn how to create a symptom check list match and how to conduct sLORETA Z score neurofeedback and automatic protocol generation. Learn about thresholds, protocols, linking symptoms to functional networks, rounds and progress charts.
Recorded on May 7, 2014
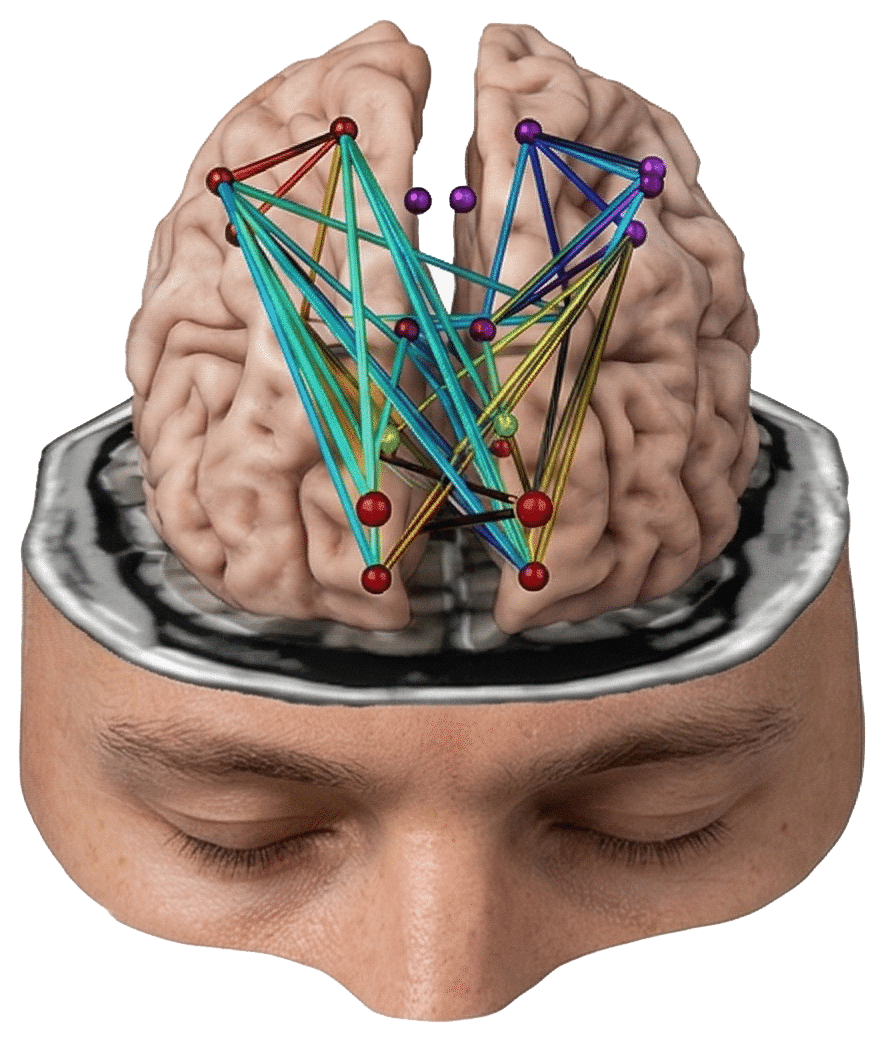
Real-time Z scores viewed in a rendered MRI that includes 88 Brodmann areas (Nodes) and connections between nodes for purposes of assessment and Neurofeedback.
Recorded on May 7, 2014
Real-time Z scores viewed in a rendered MRI that includes 88 Brodmann areas (Nodes) and connections between nodes for purposes of assessment and Neurofeedback.
Recorded on February 11, 2018
What is the NeuroNavigator and How to Use the NeuroNavigator prior to NF 3.0 and Next generation swLORETA navigator to replace the old Key Institute LORETA viewer. Evaluate Current Sources and Functional Connectivity. A Tool to Aid in Linking Symptoms to Dysregulation in Brain Networks.
Recorded on November 3, 2019
Learn about the feasibility of Cerebellar EEG Biofeedback, How to create a symptom checklist match and how to conduct swLORETA Z Score Neurofeedback and automatic protocol generation. Learn about thresholds, protocols, linking symptoms to functional networks, rounds and progress charts.
Recorded on March 2021
Learn about EEG NeuroImaging Statistics for the NeuroNavigator and 12,400 MRI Voxels. Compare pre vs post treatment effects for individuals or groups of subjects. Copy and paste images into clinic reports and do cutting edge research!